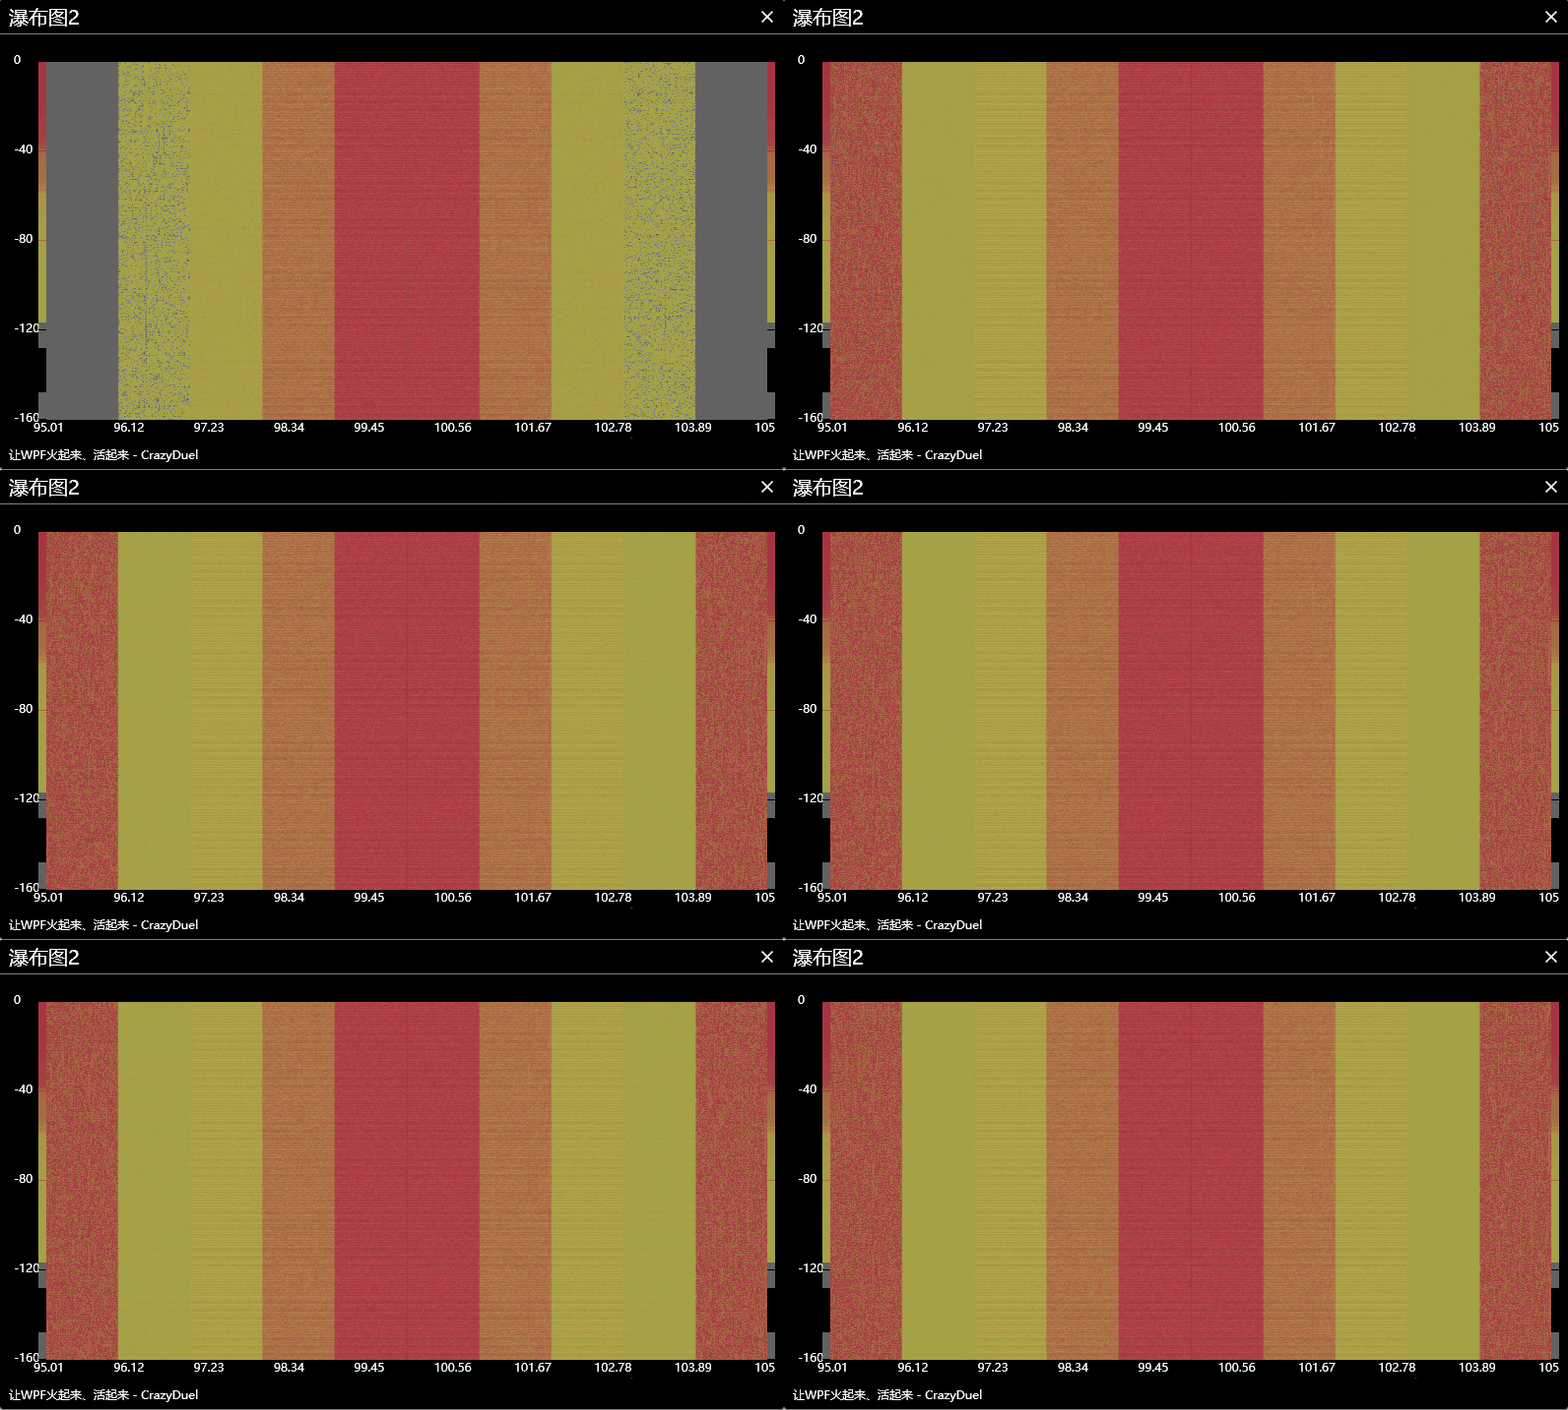
实现方式一:
将数据(Point[])根据索引沿X轴使用虚拟画布进行绘制,每个数据绘制大小为1px * 1px;最终绘制出的宽度等于数据的总长度。标记并存储当前绘制的图为PreviousBitmap; 继续置顶绘制第二组数据,第二组数据绘制完后,将标记的PreviousBitmap作为Image在Y轴距离顶部距离为1px的地方用DrawingContext.DrawImage()方式绘制,以此类推。核心代码如下:
|
1
2
3
4
5
6
7
8
9
10
11
12
13
14
15
16
17
18
19
20
21
22
23
24
25
26
27
28
29
30
31
32
33
34
35
36
37
38
39
40
41
42
43
44
45
46
47
48
|
private void DoAddDataArray(Point[] arrPoints)
{ this.Dispatcher.Invoke(DispatcherPriority.Normal, new Action(() =>
{
double dPixelWidth = Pixel;
double dContainerWidth = this.VbxContainer.ActualWidth;
double dContainerHeight = this.VbxContainer.ActualHeight;
double dPixelHeight = Pixel/2d;
double dCellHeight = 1;
double dCellWidth = 1;
DrawingVisual drawingVisual = new DrawingVisual();
DrawingContext drawingContext = drawingVisual.RenderOpen();
drawingContext.DrawRectangle(new SolidColorBrush(Colors.Blue),
new Pen(), new Rect(0, 0, dPixelWidth, dCellHeight));
// 绘制新数据
for (int i = 0; i < arrPoints.Length; i++)
{
double dCellX = Math.Round(((arrPoints[i].X - MinAxisX) / (MaxAxisX - MinAxisX)) * Pixel);
double dY = arrPoints[i].Y;
Color oColor = this.GetColor(dY);
//drawingContext.DrawRectangle(new SolidColorBrush(oColor),
// new Pen(), new Rect(dCellX, 0, dCellWidth, dCellHeight));
LinearGradientBrush lineBrush = new LinearGradientBrush();
lineBrush.GradientStops.Add(new GradientStop(Colors.Transparent, 0));
lineBrush.GradientStops.Add(new GradientStop(oColor, 0.25));
lineBrush.GradientStops.Add(new GradientStop(oColor, 0.5));
lineBrush.GradientStops.Add(new GradientStop(oColor, 0.75));
lineBrush.GradientStops.Add(new GradientStop(Colors.Transparent, 1));
drawingContext.DrawRectangle(lineBrush, new Pen(), new Rect(dCellX-1, 0, dCellWidth + 2, dCellHeight));
}
// 绘制历史数据
if (this.PreviousBitmap != null)
drawingContext.DrawImage(this.PreviousBitmap, new Rect(0, dCellHeight, dPixelWidth, dPixelHeight));
drawingContext.Close();
// 生成图像处理
RenderTargetBitmap rtbCurrent = new RenderTargetBitmap((int)dPixelWidth,
(int)dPixelHeight, 96, 96, PixelFormats.Pbgra32);
rtbCurrent.Render(drawingVisual);
this.PreviousBitmap = rtbCurrent; // 当前绘制的存为历史,下次绘制时直接调用
this.ImgMain.Source = rtbCurrent; // 显示绘制的图像
}));
} |
运行效果


实现方式二:
将数据(Point[])根据索引沿X轴使用虚拟画布进行绘制,每个数据绘制大小为1px * 1px;最终绘制出的宽度等于数据的总长度。创建一个Rectangle,将绘制的图赋值给Rectangle.Fill属性,将绘制过程中不断创建的Rectangle插入控件Stackpanel的首位。核心代码如下:
private void DoAddDataArray(Point[] arrPoints)
{
    this.Dispatcher.Invoke(DispatcherPriority.Normal, new Action(() =>
    {
        double dPixelWidth = Pixel;
        double dContainerWidth = this.VbxContainer.ActualWidth;
        double dContainerHeight = this.VbxContainer.ActualHeight;
        double dPixelHeight = Pixel / 2d;

        DrawingVisual drawingVisual = new DrawingVisual();
        DrawingContext drawingContext = drawingVisual.RenderOpen();
        drawingContext.DrawRectangle(new SolidColorBrush(Colors.Blue),
                new Pen(), new Rect(0, 0, dPixelWidth, 1));

        // 绘制新数据
        double dCellHeight = 1;
        double dCellWidth = 1;
        for (int i = 0; i < arrPoints.Length; i++)
        {
            double dCellX = Math.Round(((arrPoints[i].X - MinAxisX) / (MaxAxisX - MinAxisX)) * Pixel);
            double dY = arrPoints[i].Y;
            Color oColor = this.GetColor(dY);
            //drawingContext.DrawRectangle(new SolidColorBrush(oColor),
            //    new Pen(), new Rect(dCellX, 0, dCellWidth, dCellHeight));
            LinearGradientBrush lineBrush = new LinearGradientBrush();
            lineBrush.GradientStops.Add(new GradientStop(Colors.Transparent, 0));
            lineBrush.GradientStops.Add(new GradientStop(oColor, 0.25));
            lineBrush.GradientStops.Add(new GradientStop(oColor, 0.5));
            lineBrush.GradientStops.Add(new GradientStop(oColor, 0.75));
            lineBrush.GradientStops.Add(new GradientStop(Colors.Transparent, 1));
            drawingContext.DrawRectangle(lineBrush, new Pen(), new Rect(dCellX - 0.5, 0, dCellWidth + 1, dCellHeight));
        }
        drawingContext.Close();

        // 生成图像处理
        RenderTargetBitmap rtbCurrent = new RenderTargetBitmap((int)dPixelWidth, (int)1, 96, 96, PixelFormats.Pbgra32);
        rtbCurrent.Render(drawingVisual);

        Rectangle rect = new Rectangle();
        rect.Width = Pixel;
        rect.Height = 1;
        rect.Fill = new ImageBrush(rtbCurrent);
        // SpContainers  ---- Stackpanel
        this.SpContainers.Children.Insert(0, rect);
        if (this.SpContainers.Children.Count > 500)
            this.SpContainers.Children.RemoveAt(500);
    }));
}
运行效果:


相对而言,方式二由于不断插入新的Rectangle。下移效果为控件位置变化所呈现,不像方式一是一张完整图,故画质欠缺。
性能和测试:
采用Timer生成随机数据进行测试。10毫秒1组,每组1000个数据点。 相当于每秒绘制10万个点。

测试时在Release模式下,开启多个子模块,性能勉强能接受。

环境:
语言: C#
工程:WPF
工具:Visual Studio 2017
系统:Windows
第三方插件:无
微信扫码下载源代码:
